|
|
Post by Bubba on Jul 9, 2007 11:24:22 GMT -6
Well, our DKL (2 sided car) experiment continues. Good news: With the change out to lightened wheels we got her down to a 3.0213 low time (Donkey Kong side up). Bad news: It looks like we might have under-done it (or wrongly done it i.e. new product) when it comes to lube. Both sides had times increasing pretty steadily over the 6 heats, and both sides had a Standard Deviation of nearly 0.02 (ouch!). Probably not bad enough to make good on our threat to switch to golf, but certainly have some more head-scratchin' to do. For my information, please confirm which ran first, the Stock class or the Pro-Stock class. I want to make sure I had the sequence correct. Might have to switch back to our previous lube, do some better break-in and resend in August.  p.s. Can't seem to get the videos to work, any shimmyin' or other nasty behavior you guys saw with either side up? |
|
|
|
Post by Mr. Slick on Jul 10, 2007 20:42:51 GMT -6
Rookie, Limited. Stock, Pro-Stock & HotRod 66, Modified & Pro-Modified is the sequence for now. (correct me if I'm wrong!)  Once there are enough in the combined divisions to allow us to split them we will. There is a lot of wait time if you are always waiting for a car to come back from the prior race to start the next race. |
|
|
|
Post by Bubba on Jul 11, 2007 9:00:46 GMT -6
Rookie, Limited. Stock, Pro-Stock & HotRod 66, Modified & Pro-Modified is the sequence for now. (correct me if I'm wrong!) With that being the case (Stock before Pro-Stock), the DKL car had the following times First run (Donkey Kong side up): 3.0213 3.0375 3.0396 3.0533 3.0475 3.0757 Second run (Luigi side up): 3.0821 3.0766 3.0979 3.1000 3.1327 3.0933 It would appear (at least at first glance) that I have a lubrication breakdown problem.  |
|
|
|
Post by Mr. Slick on Jul 11, 2007 10:04:27 GMT -6
yep. . . pretty linear . . . so for each run (x=1..12) y = 0.0084x + 3.0172 maybe we should see if GPRM will generate these for all of the cars. . . Cool upgrade with the graph included. . . . 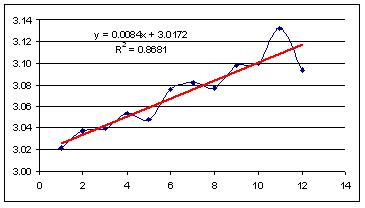 |
|
|
|
Post by Bubba on Jul 11, 2007 12:08:02 GMT -6
Maybe with color coding for the dots to indicate in which lane (red, white, or blue) the heat was being run?
Note that for the graph above, in heats 4 and beyond:
Heats run in the Blue lane had values on the high side (heats 6, 9, 11)
Heats run in the Red lane pretty well hugged the line (heats 4, 7, 10)
Heats run in the White lane had values on the low side (heats 5, 8, 12)
|
|
|
|
Post by Mr. Slick on Jul 11, 2007 12:38:29 GMT -6
how about this: 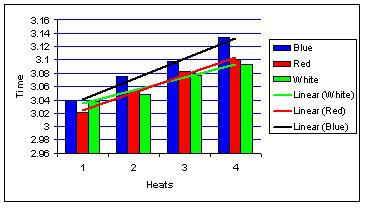 |
|
|
|
Post by Bubba on Jul 11, 2007 12:42:25 GMT -6
Very nice. You guys certainly run a "full service" outfit. Now I just need to figure out how to get our lines flatter and lower |
|
|
|
Post by docjobe on Sept 16, 2007 10:43:40 GMT -6
How do you guys get charts and tables imported?
Those above from Mr Slick look pretty good.
Doc Jobe
|
|
|
|
Post by Mr. Slick on Sept 17, 2007 6:11:34 GMT -6
What do you mean? Using GPRM you can export the data to a CSV format and use your favorite graphing system. Speaking of graphs . . . what kind should we add for the new version? If we can get the graphs determined then we can see about getting them into the monthly reports. . . . |
|